Work Zone Driver Experience Survey
What 1,192 Northeast drivers told us about driving through work zones: what actually prompts them to slow down, how professional drivers differ from everyone else, where they get their information, and what frustrates them most.
How the survey was run
An example of the geo-targeted Facebook ad used to recruit respondents.
- 1,192 respondents across the nine Northeast states, recruited through geo-targeted Facebook advertising.
- Administered on the Qualtrics platform under UMass Amherst IRB Protocol #6509.
- 380 free-form comments coded by theme for qualitative analysis.
- Findings were triangulated with the state of the practice review and the crash data analysis.
How responses were compared
Differences between groups were tested with the Mann-Whitney U test, a non-parametric method. Unlike a t-test, it does not assume the data are normally distributed, which makes it appropriate for ordinal survey responses such as Likert-scale ratings. It compares whether the distribution of responses between two groups is meaningfully different without assuming the shape of the underlying data. (For a technical reference, see the NIST/SEMATECH e-Handbook of Statistical Methods.)
Three sets of comparisons were run:
- Professional vs. non-professional: drivers with a commercial driver's license (CDL) compared with non-CDL drivers, to see whether driving for a living changes work zone experience.
- By age: each age group compared against the 35 to 50 group, used as the reference because it was well represented and central to the driving population.
- By state: each state compared against the rest of the region, to surface geographic differences.
Who responded and where
Responses were not evenly distributed. Massachusetts accounted for the largest share, likely because Facebook's ad-serving algorithm showed the survey more often to Massachusetts users given the UMassSafe name. This uneven distribution is a limitation to keep in mind when reading state-level results.
Select or hover a state to see its respondent count, or read the full table below.
| State | Under 35 | 35 to 50 | 51 to 65 | 65+ | Total | Share |
|---|---|---|---|---|---|---|
| Connecticut | 3 | 13 | 33 | 10 | 59 | 5% |
| Maine | 3 | 14 | 30 | 33 | 80 | 7% |
| Massachusetts | 28 | 85 | 171 | 117 | 401 | 34% |
| New Hampshire | 4 | 9 | 19 | 28 | 60 | 5% |
| New Jersey | 5 | 12 | 46 | 33 | 96 | 8% |
| New York | 19 | 45 | 103 | 118 | 285 | 24% |
| Pennsylvania | 7 | 29 | 49 | 58 | 143 | 12% |
| Rhode Island | 2 | 8 | 11 | 12 | 33 | 3% |
| Vermont | 3 | 9 | 14 | 8 | 34 | 3% |
Counts total 1,191 across states; the full sample was 1,192 respondents. Older drivers are well represented, which is relevant because age was one of the strongest predictors of attitudes (below).
Beliefs and safety culture
The survey included six belief questions (rated 1 for disagree to 5 for agree) about enforcement, personal behavior, and social expectations in work zones. The chart below shows, for each belief, which states differed significantly from the rest of the region. New York stood out as consistently more safety-minded; Connecticut, Massachusetts, Rhode Island, and Vermont tended to agree less.
| Belief | CT | ME | MA | NH | NJ | NY | PA | RI | VT |
|---|---|---|---|---|---|---|---|---|---|
| Police will stop careless drivers | ▼lower than the region | no significant difference | ▼lower than the region | ▲higher than the region | no significant difference | ▲higher than the region | no significant difference | no significant difference | ▼lower than the region |
| Willing to slow down even more | no significant difference | no significant difference | no significant difference | no significant difference | ▲higher than the region | ▲higher than the region | no significant difference | no significant difference | no significant difference |
| Most drivers already drive cautiously | ▼lower than the region | no significant difference | no significant difference | no significant difference | no significant difference | ▲higher than the region | no significant difference | ▼lower than the region | no significant difference |
| Friends and family expect caution | no significant difference | no significant difference | no significant difference | no significant difference | no significant difference | no significant difference | no significant difference | no significant difference | no significant difference |
| I slow more when I know work is active | no significant difference | no significant difference | no significant difference | no significant difference | no significant difference | no significant difference | no significant difference | no significant difference | no significant difference |
| Nav-app alerts make me slow down | no significant difference | no significant difference | no significant difference | no significant difference | no significant difference | no significant difference | no significant difference | no significant difference | no significant difference |
What each belief showed
- Drivers who speed or drive carelessly in work zones are likely to be stopped by police. New York and New Hampshire agreed more strongly than the region; Connecticut, Massachusetts, and Vermont agreed less, pointing to weaker perceived enforcement there.
- Even if I am already driving more cautiously than others, I am happy to slow down even more in a work zone. New Jersey and New York agreed more strongly. CDL drivers and drivers 65 and older also agreed more than their comparison groups.
- Most drivers try to reduce their speed and drive more cautiously in work zones. Drivers 51 and older agreed more. CDL drivers agreed less, reflecting skepticism about how other drivers actually behave.
- My friends and family expect me to reduce my speed and drive more cautiously in work zones. No significant state or professional differences; only drivers 65 and older agreed more than the 35 to 50 group.
- When I know road work is actively happening, I slow down even more, because I have lost trust in signs, cones, or lane shifts that stay up too long. No significant state or age differences; CDL drivers agreed more than non-CDL drivers.
- When I receive a navigation-app alert of a work zone, I am more likely to reduce my speed and drive more cautiously. No significant state differences; drivers 65 and older and CDL drivers agreed more than their comparison groups.
Cross-cutting patterns: drivers 65 and older agreed more strongly on nearly every belief, indicating a stronger safety culture. Professional (CDL) drivers agreed more on items tied to their own actions, such as slowing down when work is visibly active and responding to navigation-app alerts, but agreed less that other drivers behave cautiously.
What prompts safe driving in work zones
Respondents rated how effective different countermeasures are at prompting them to drive safely. Visible human presence and physical cues consistently outperformed informational signs.
Share of respondents rating each countermeasure effective
Share of the 1,192 respondents rating each measure effective.
Takeaway: drivers respond to visible human presence and physical cues (workers, equipment, flaggers) far more than to informational signs alone. Penalty signs, the lowest-rated measure, were rated effective by only 39% of respondents.
Important: these countermeasures work together, not in isolation. A lower effectiveness rating does not mean a measure should be dropped. Layered countermeasures reinforce one another, and tools such as signs and message boards remain essential for legal, safety, and traveler-information reasons even when drivers rate them less influential on their own. The ratings show what most prompts drivers to slow down, not which measures to keep or remove.
Examples of the images shown to respondents
Respondents rated each countermeasure after viewing an example image. A selection of those images is shown below.
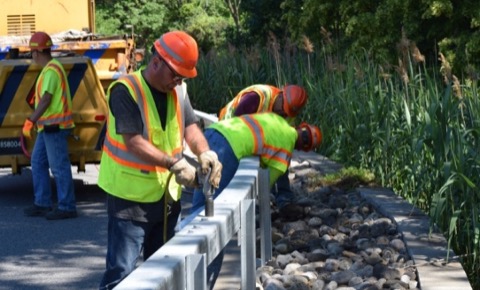
Roadway workers present 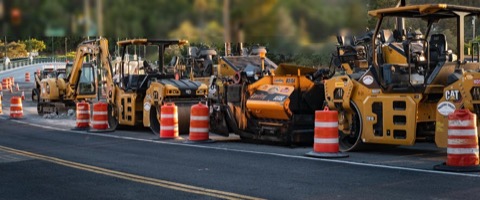
Heavy equipment present 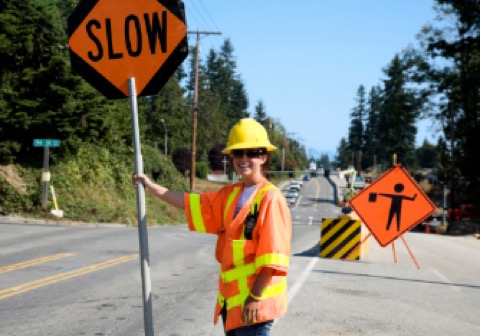
Active flaggers 
Police detail 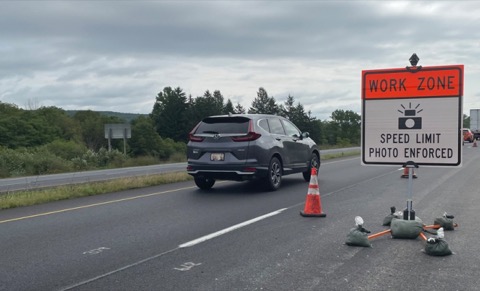
Speed safety cameras 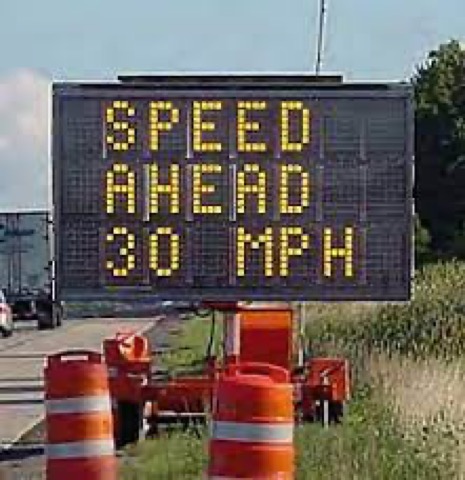
Digital message board 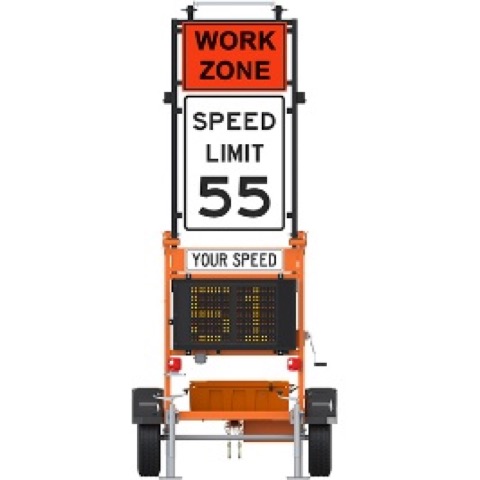
Speed feedback sign 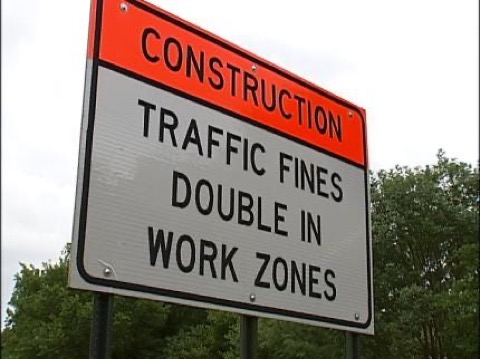
Penalty sign
Professional vs. non-professional drivers
Comparing drivers with a commercial driver's license (CDL) against non-CDL drivers revealed a consistent pattern: professional drivers respond more strongly to enforcement and penalty cues, and to information, but are more skeptical that other drivers behave safely.
Where professional (CDL) drivers responded more strongly
- Penalty signs (fines doubled): CDL drivers were more likely than non-CDL drivers to slow down for a sign warning of doubled fines, suggesting professional drivers are more influenced by the prospect of fines.
- Speed safety cameras: CDL drivers were more strongly influenced to slow down for speed safety cameras than non-CDL drivers, reinforcing that penalties and enforcement weigh more heavily on professional drivers.
- Heavy equipment near the road: CDL drivers were more likely to rate the visibility of heavy equipment as an effective prompt to drive safely.
- Navigation-app alerts: CDL drivers reported being more likely to slow down after a navigation-app work zone alert.
- Acting on known active work: CDL drivers more strongly agreed that when they know work is actively happening, they slow down further because they have lost trust in signs, cones, or lane shifts that stay up too long.
Where professional drivers were more skeptical
- Trust in other drivers: CDL drivers rated the belief that "most drivers try to reduce their speed and drive more cautiously in work zones" lower than non-CDL drivers, reflecting more skepticism about how others actually behave.
Age followed a similar arc: drivers 65 and older rated nearly every safety measure and belief higher than the 35 to 50 reference group, while drivers under 50 were consistently the hardest to reach. New York respondents were the most consistently positive across measures, in several cases aligning with the state's use of speed safety cameras.
How drivers get work zone information
Navigation apps and social media, not official state channels, are where most drivers learn about work zones. Choose a state to see its own pattern; a red line then marks where the rest of the region sits on each source.
Respondents could select multiple sources. When a single state is shown, the red line marks the rest of the region (all other states, respondent-weighted) for that source.
Show the full per-state table
| State | Google Maps | Social media | Radio | Waze | News outlets | Word of mouth | State 511 services | Apple Maps | Trucker Path | Receive no work zone information |
|---|---|---|---|---|---|---|---|---|---|---|
| Connecticut | 31% | 27% | 32% | 31% | 18% | 22% | 11% | 8% | 5% | 8% |
| Maine | 29% | 27% | 28% | 16% | 15% | 20% | 6% | 8% | 7% | 12% |
| Massachusetts | 36% | 31% | 25% | 29% | 18% | 18% | 6% | 7% | 4% | 10% |
| New Hampshire | 35% | 31% | 20% | 28% | 11% | 18% | 9% | 3% | 5% | 22% |
| New Jersey | 33% | 32% | 34% | 30% | 20% | 14% | 12% | 4% | 5% | 6% |
| New York | 36% | 28% | 32% | 19% | 23% | 17% | 14% | 8% | 4% | 11% |
| Pennsylvania | 36% | 34% | 28% | 19% | 25% | 20% | 31% | 4% | 4% | 9% |
| Rhode Island | 27% | 40% | 29% | 24% | 29% | 24% | 0% | 9% | 0% | 18% |
| Vermont | 36% | 46% | 13% | 21% | 21% | 18% | 31% | 8% | 5% | 15% |
| Regional total | 35% | 31% | 28% | 24% | 20% | 18% | 13% | 6% | 4% | 11% |
Information changes how drivers respond to delay
Drivers who receive work zone information ahead of time make more measured rerouting decisions; those who do not are more likely to divert for only a minor slowdown.
| Response | Receive information | Do not receive information |
|---|---|---|
| Would avoid any or all work zones | 25% | 21% |
| Only for a slowdown or lane shift | 11% | 23% |
| Less than 5-minute delay | 12% | 11% |
| 5 to 10-minute delay | 26% | 21% |
| 10 to 20-minute delay | 15% | 11% |
| More than 20-minute delay | 8% | 7% |
| Would not alter route regardless | 4% | 7% |
What drivers told us
The 380 free-form comments were coded into themes. Two dominate: a perceived lack of meaningful enforcement, and unsafe driver behavior. A credibility gap runs through the results: police details rated effective in concept (79%), yet the single most common complaint (208 comments) was that enforcement often appears inactive. Choose a state to read its own comment summary and ranked themes.
Connecticut: 27 comments
Connecticut respondents reported widespread enforcement ineffectiveness, misleading signs, and hazardous lighting. Many requested speed safety cameras and more consistent work zone setups.
Maine: 23 comments
Maine respondents repeatedly emphasized nonexistent enforcement and unsafe driver behavior. Inactive work zones and inadequate lane widths were additional concerns from both drivers and roadway workers.
Massachusetts: 123 comments
Massachusetts comments overwhelmingly criticized the effectiveness of police details, stale or incorrect signs, and blinding lighting. Many respondents advocated for flaggers and consistent, safe work zone designs.
New Hampshire: 16 comments
New Hampshire comments came from both roadway workers and drivers describing inattentive motorists, stale signs, and poor enforcement, with blinding lights and inconsistent lane-closure information adding to the concerns.
New Jersey: 25 comments
New Jersey comments focused on enforcement credibility and sign legitimacy, widely criticizing police details that do not enforce rules and work zones that remained posted without active work.
New York: 97 comments
New York respondents highlighted severe speeding, tailgating, and distraction, with many roadway workers describing near misses. Lack of enforcement, stale signs, and blinding lights were dominant concerns.
Pennsylvania: 48 comments
Pennsylvania comments reflected deep frustration with both driver behavior and inconsistent work zone setups. Many respondents demanded stronger enforcement, stricter penalties, and better adherence to safe-design standards.
Rhode Island: 14 comments
Rhode Island respondents consistently reported unchecked speeding and poor enforcement, especially during night work. CDL drivers and roadway workers described serious experiences when drivers ignored signs or failed to recognize active work areas.
Vermont: 7 comments
Vermont comments reflected risky experiences attributed to speeding, inattentive drivers, and inadequate police enforcement.
Within a state, theme counts can add to more than the comment total because a single comment may touch several themes.
The full survey report, including complete question-level results and statistical detail, will be posted on this site when published.